
In May, we hit a wall. Our browser-automation agents were running on a managed cloud browser service, and when we tried to push structured output through our local model layer, the whole thing fell apart. That single failure forced a question we'd been deferring: should we build our own browser fleet?
We decided yes. But not for the reasons you'd expect. The real insight came from benchmarking.
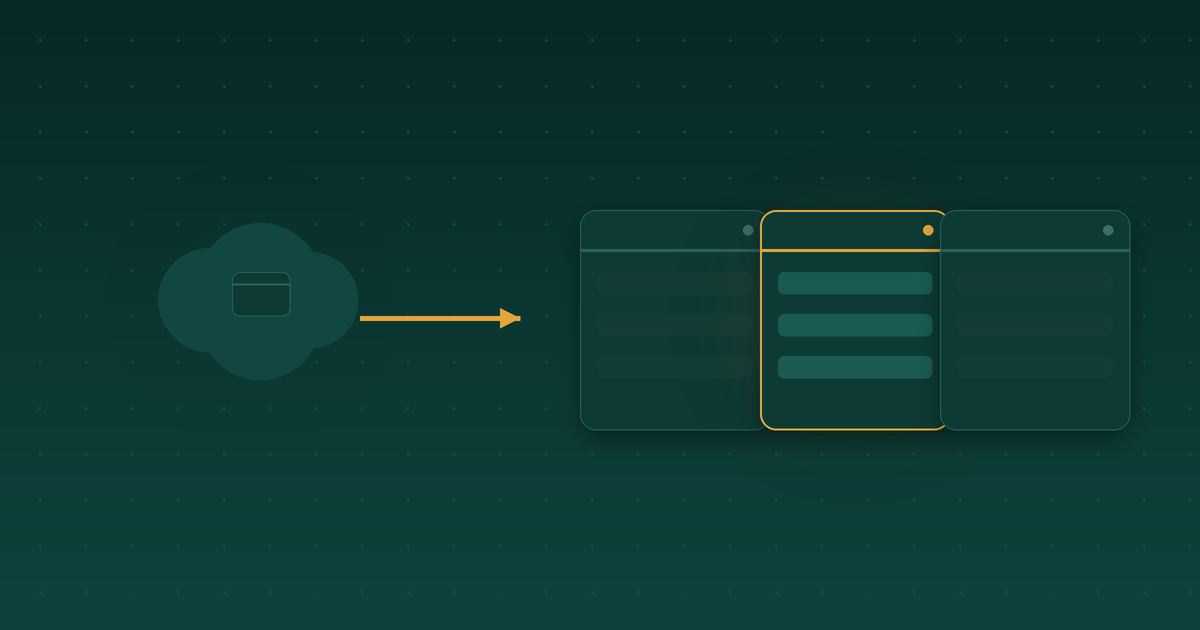
The architecture decision: browser local, AI calls hosted
We settled on the same pattern the managed services use internally: Chromium runs locally on our own infrastructure with a CDP (Chrome DevTools Protocol) debugging port exposed. Our existing browser-automation MCP server connects to it remotely over CDP. This reuses proven code instead of duplicating server logic.
Phase 1 spins up a single slot. Phase 2 scales to three concurrent slots, each bound to its own persistent profile. Our hardware has 128GB of unified memory, which gives headroom for 3-4x concurrent inference with bandwidth-shared degradation.
We're not running local models for the agent reasoning. That path (a local serving stack) has near-zero public success reports with our automation framework, and a hardware mismatch made it a separate spike we deferred.
What the benchmarking revealed about model selection
Here's where we found our opinion: the model you assume is the default for browser agents probably isn't. We'd assumed one default. We were wrong.
The managed platforms don't all default to the same model, and the documented workhorse across public browser-agent implementations is a different, cheaper model with strict JSON schema support and the most real-world mileage. So we stopped assuming and benchmarked.
We tested three providers. The harness runs 15 fixtures (10 happy paths + 5 failure modes: timeouts, cookie overlays, anti-bot challenges, JSON schema edge cases, empty results) against 20 runs each. Winner selection uses a single ranking metric across three dimensions:
- Success rate with a Wilson 95% confidence interval
- Cost broken down by cached vs. uncached tokens
- Latency percentiles (p50/p95/p99)
A model has to rank top-2 in all three dimensions to make the cut. We pinned model snapshot IDs and fixture content hashes so we can replay the benchmark at 30/60/90 days and detect drift. Total spend cap per provider: $5.
The model that wins on success rate might lose on cost; the one that wins on cost might have tail latencies that spike. You need all three.
Multi-agent execution: why we didn't use subprocess-per-task
This is the architectural decision worth talking about directly.
When we moved to three concurrent slots, the obvious path was to spawn a subprocess per task, the way a stdio MCP server works. But that costs 5-20 seconds of startup tax per task. At scale, that adds up. More importantly, it wastes the hardware we just bought.
Instead, we built a long-running runner daemon per worker that exposes JSON-RPC over a Unix socket. The daemon stays alive and keeps a persistent connection to Chromium over CDP. A lockfile mediates concurrent access when both the MCP server and the runner daemon attach to the same Chromium instance.
Why not refactor the existing MCP server to handle multi-task concurrency? Because that server is per-agent-instance by design. Changing it would be unjustified scope creep. The runner daemon is new, purposeful, and can outlive any single task.
Task flow looks like this:
- A task backlog with custom fields: task type, target, schema ID, audit template, max seconds, dry-run required, priority
- A poller writes work items to a local SQLite work queue (WAL mode)
- The worker daemon atomically claims a task via
BEGIN IMMEDIATE; UPDATE ... RETURNINGwith an idempotency key and an attempt UUID - JSON-RPC dispatch to the runner daemon
- Result written back to SQLite, a comment posted to the task, a team-chat message sent (with any auth tokens redacted)
A registry-backed schema system in our codebase provides JSON Schema files for extract validation, multi-step audit templates with variable interpolation, and canary URLs for auth-check probing.
Auth-check runs per-slot on a 5-minute interval with a three-state machine (green/yellow/red) and debouncing. We only alert on red transitions; silent recovery from yellow to green stays quiet. That keeps signal-to-noise high.
What ships now, what waits
Phase 2 ships two task types: extract (read-only data pulls) and audit (multi-page workflows). We've built the safe-write guard and unit-tested it, but act (write actions) and script (versioned procedures) are Phase 3. We're running synthetic trials against sandbox records to prove the guard works, but nothing goes to production yet.
Multi-target tasks that need a planner above the worker daemons also wait for Phase 3.
How we measure success
Phase 1 runs 14 days side-by-side with the managed service:
- Success rate ≥ 0.95
- p95 latency ≤ 1.5x the managed baseline
- Re-login incidents ≤ 1
Phase 2 runs 14 days in production (read-only scope only):
- Per-task success ≥ 0.93
- p95 latency ≤ 45 seconds (roughly 2x single-slot baseline)
- Escalations ≤ 3/day (escalation = auth red state, system error, or unacknowledged failure within 4 hours)
We also do weekly manual checks for any platform-side security signals (MFA challenges, security emails, rate-limit banners). Any signal halts the trial for a session-strategy re-eval. The read-only constraint keeps blast radius small.
The daily operator loop: a morning dashboard check for slot status and queue depth, an auto-posted daily summary with a ping-budget breakdown, backlog grooming, per-task notifications, escalation-only pings, and a short end-of-day review. Accepted and rejected tasks feed the Phase 3 improvement loop.
The one thing we can't design for
We graded this plan 9/10 after an adversarial review. The one point we can't engineer is the target platform's reaction to three concurrent sessions over 14 days. That's observable, not designable in advance. We'll measure it and adapt.